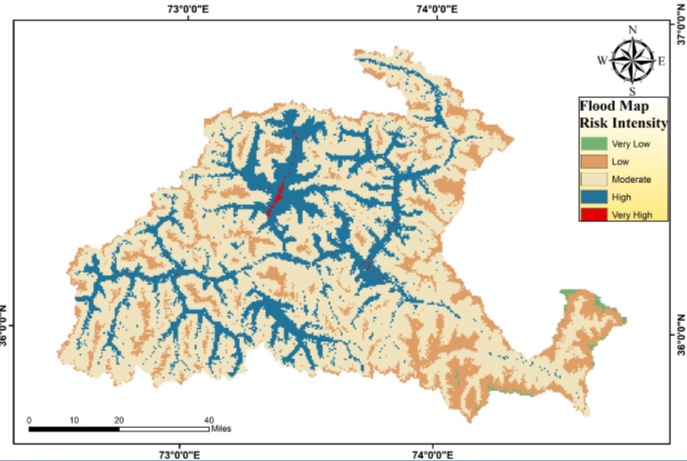
Flooding, one of the most common and devastating natural disasters in the world, has claimed many lives and destroyed businesses. Climate change has increased the risk of natural disasters like flooding. Accurate evaluation of food risk is critical in disaster management.Flood risk maps are generated by combining AHP weights with geographical data in a geographic information system (GIS). Through flood risk map, areas under very low, low, moderate, high, and very high risk were determined . This comprehensive model helps in identifying high-risk zones, prioritizing mitigation measures, and informing urban planning and disaster management strategies.
Objectives
1-To create accurate flood hazard map
2- To identify vulnerable areas
3- To suggest mitigation strategies
Socio-Economic Benefit
Knowing where floods might happen helps us put resources where they're needed most, like making stronger barriers and improving drainage. This stops damage to homes and buildings during floods. Planning ahead with evacuation routes and storing supplies in the right places based on flood risks can save lives and help communities recover faster after a flood. Maps showing flood-prone areas can help decide where it's safe to build, avoiding risky spots and keeping people and property safer in the long run.
Methodologies
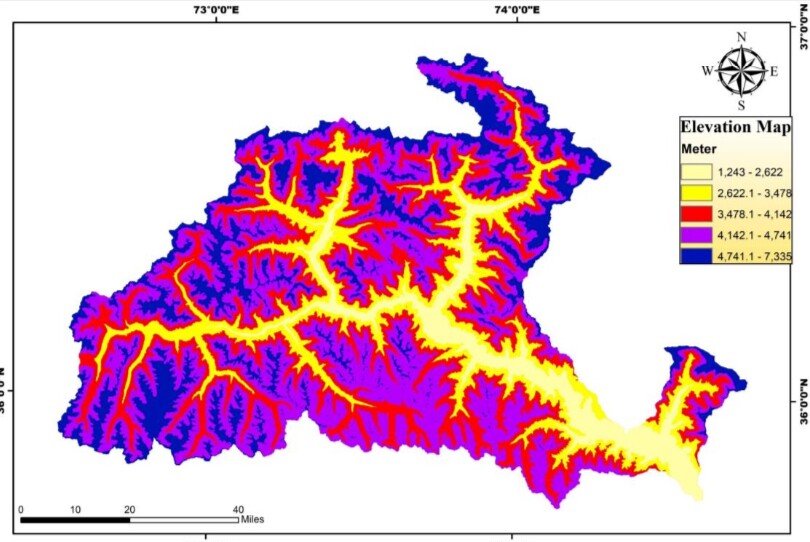
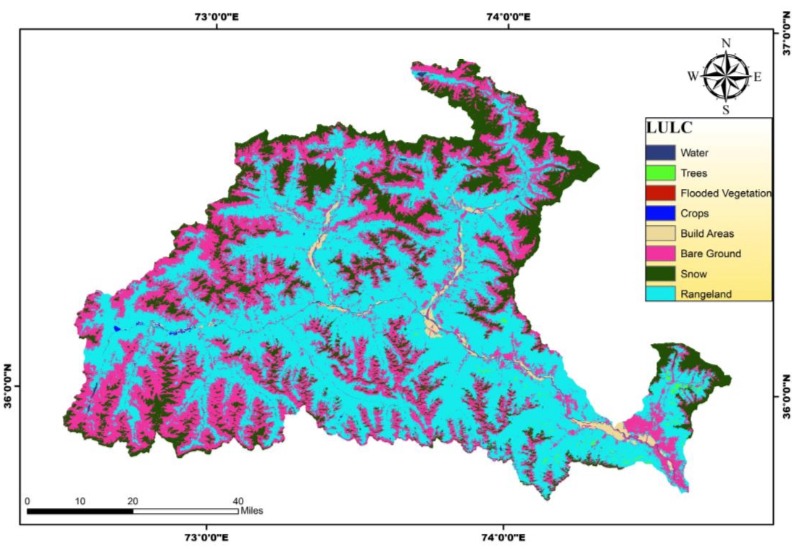
The first step is to collect data of Gilgit . This data include Digital Elevation Model, Rainfall Data Land use/Land cover Data and Soil data
After the collection of data , the data is preprocessed.
The next step is generation of elevation, slope, Topographic Wetness Index and Drainage Density Map from Digital Elevation Model.
Then Rainfall, Soil and LULC maps are prepared from their corresponding data.
From River and Road network data of Gilgit , Distance to river and road is calculated and maps are prepared.
Then these maps are reclassified and Analytical Hierarchy Technique AHP is applied which includes pairwise comparison and weight determination of each factor.
Finally, the Flood Hazard Map is prepared through assigning weightage to all the factors calculated through AHP and overlaying of all the maps.
Outcome
The study’s findings indicated that elevation, slope, rainfall, and distance to the river were the primary factors influencing the occurrence of flooding in the area.
Less impact was observed on flooding from parameters such as, TWI, land use land cover , drainage density, distance to road and soil type.
Overlaying map determined that 0.16% of total area is classified as very high risk, 19.21% as high risk, 63.65% as moderate risk, 16.49% as low risk and 0.46% as very low risk of flooding.